Showing posts with label M&Ms. Show all posts

Friday, January 23, 2015

M&M ANOVA

Khan Academy does a nice job of explaining ANOVA at this link.  This is in fact where I learned it.  Below I have a nice application of ANOVA using M&Ms that I would like to share.

There are numerous tables below which can be glided over without any loss of understanding.  Indeed, if you just read the prose in between the tables you will be far better off.

In the Fall of 2014, I assigned a series of activities to my Elementary Statistics involving M&Ms.  These activities begin here. There were six groups of students involved and each group took a sample of ten bags of M&Ms.  These samples are listed below.

Group 1
Color/Bag 1 2 3 4 5 6 7 8 9 10
Red 2 5 2 4 3 7 3 1 7 5
Orange 7 3 6 5 6 7 5 7 6 9
Yellow 2 3 0 1 2 0 2 4 3 4
Green 3 0 6 6 3 2 1 3 4 2
Blue 3 5 4 2 4 7 4 5 4 5
Brown 1 1 1 0 1 3 1 1 1 3

Group 2
Color/Bag 1 2 3 4 5 6 7 8 9 10
Red 2 2 3 2 2 3 1 6 3 3
Orange 3 4 0 4 4 4 3 2 2 3
Yellow 2 5 5 1 1 1 0 1 2 4
Green 3 1 5 4 4 3 4 2 4 2
Blue 3 2 2 4 3 3 6 1 4 4
Brown 3 2 1 1 2 2 2 4 1 1
Group 3
Color/bag 1 2 3 4 5 6 7 8 9 10
Red 1 1 1 0 2 3 0 4 0 0
Orange 2 0 1 2 5 6 5 3 1 0
Yellow 1 1 2 0 3 5 0 7 1 3
Green 1 3 1 2 2 1 5 4 1 1
Blue 2 2 4 2 4 5 5 2 2 1
Brown 1 0 0 1 2 0 3 1 2 1
Group 4
Color/Bag 1 2 3 4 5 6 7 8 9 10
Red 4 5 1 3 1 0 2 2 3 2
Orange 1 1 7 3 3 6 3 5 4 6
Yellow 1 4 6 0 3 2 3 0 3 4
Green 2 3 1 8 4 4 5 6 1 3
Blue 5 1 1 5 4 2 3 3 3 2
Brown 2 3 4 1 3 3 2 1 2 0
Group 5
Color/Bag 1 2 3 4 5 6 7 8 9 10
Red 2 3 1 5 5 2 0 1 5 5
Orange 2 0 1 3 2 3 3 1 5 3
Yellow 6 2 5 2 3 4 7 7 1 5
Green 2 5 5 7 1 2 4 6 5 1
Blue 1 5 6 2 4 5 4 1 2 3
Brown 3 6 0 1 3 2 3 2 1 1
Group 6
Color/Bag 1 2 3 4 5 6 7 8 9 10
Red 1 2 2 4 3 3 1 2 1 7
Orange 3 3 1 1 3 1 3 2 1 2
Yellow 3 5 3 3 2 2 3 6 4 4
Green 3 1 7 3 3 6 2 2 4 2
Blue 4 4 1 4 3 3 3 4 4 3
Brown 2 1 4 1 4 2 4 2 5 1
This is a nice collection of real data and my thought was to make the most of it.  As a sample size of ten is small, my thought was to pool the data, but before this can be legitimately done, it must be justified.  One might argue that since all of the samples were taken from M&M's that might be justification enough, but I had lingering doubts.  What if proportion of M&M color is not consistent from batch to batch? What if M&Ms are put out in a variety of Fun Sizes?  What if my students had just royally goofed?  In order to be careful, I decided that after having taught elementary statistics for twenty years it was time to learn ANOVA.

I first wanted to get an good confidence interval for the average number of M&Ms per bag. I calculated that using the data for each group, finding the bag by bag total.  I put that into the following table:

Bag/Group 1 2 3 4 5 6
1 18 16 8 15 16 16
2 17 16 7 17 21 16
3 19 16 9 20 18 18
4 18 16 7 20 20 16
5 19 16 18 18 18 18
6 26 16 20 17 18 17
7 16 16 18 18 21 16
8 21 16 21 17 18 18
9 25 16 7 16 19 19
10 28 17 6 17 18 19
I then calculated the mean for each of the groups individually and the grand mean of the total pooled data.  Using this, I calculated the sum of the squares for differences within each of the groups and the sum of the squares for differences between the groups.  Those calculations are in the table below:

DATA
Bag/Group 1 2 3 4 5 6
1 18 16 8 15 16 16
2 17 16 7 17 21 16
3 19 16 9 20 18 18
4 18 16 7 20 20 16
5 19 16 18 18 18 18
6 26 16 20 17 18 17
7 16 16 18 18 21 16
8 21 16 21 17 18 18
9 25 16 7 16 19 19
10 28 17 6 17 18 19
GrandMean Means
17.07 20.7 16.1 12.1 17.5 18.7 17.3

SSW 
1 2 3 4 5 6
7.29 0.01 16.81 6.25 7.29 1.69
13.69 0.01 26.01 0.25 5.29 1.69
2.89 0.01 9.61 6.25 0.49 0.49
7.29 0.01 26.01 6.25 1.69 1.69
2.89 0.01 34.81 0.25 0.49 0.49
28.09 0.01 62.41 0.25 0.49 0.09
22.09 0.01 34.81 0.25 5.29 1.69
0.09 0.01 79.21 0.25 0.49 0.49
18.49 0.01 26.01 2.25 0.09 2.89
53.29 0.81 37.21 0.25 0.49 2.89
Sums
156.10 0.90 352.90 22.50 22.10 14.10

SSB
1 2 3 4 5 6
13.20 0.93 24.67 0.19 2.67 0.05
13.20 0.93 24.67 0.19 2.67 0.05
13.20 0.93 24.67 0.19 2.67 0.05
13.20 0.93 24.67 0.19 2.67 0.05
13.20 0.93 24.67 0.19 2.67 0.05
13.20 0.93 24.67 0.19 2.67 0.05
13.20 0.93 24.67 0.19 2.67 0.05
13.20 0.93 24.67 0.19 2.67 0.05
13.20 0.93 24.67 0.19 2.67 0.05
13.20 0.93 24.67 0.19 2.67 0.05
Sums
132.01 9.34 246.68 1.88 26.68 0.54
The SSW sums to 568.6 and the SSB sums to 417.1.  The numerator has m-1=5 degrees of freedom as we are comparing m=6 groups. The denominator has m*(n-1)=6*(10-1)=54 degrees of freedom as each of those groups took a sample of size n=10.  This gives an F test-statistics of F=7.92.  The critical number for those degrees of freedom with a significance level of  alpha=0.10 is 1.957.  As 7.92 is greater than 1.957, we must conclude that these samples are not all drawn from the same population.

This came as something of surprise to me.  As an educator of over 30 years experience, I immediately suspected student error.  Looking at the SSW and SSB table above, I noted that the numbers from group 3 were considerably larger than the rest.  I was curious as whether and how they had erred.  Discerning this was easy because I had had the students document their process.  In looking at the documentation from group 3, I found the follow photograph:


The student had been told to use Fun Size M&Ms.  It was assumed that they would plain and that the bags would not be mixed.  We are well tutored in how one spells ass-u-me. 

I would be remiss at this point, however, if I did not say that I had pushed this further. Elementating group 3 does not fix the problem.  The remaining groups are not sampling the same populations and an examination of the documentation of the other groups does not reveal a similar glaring error in methods.   Of all six groups, only 4 and 6 seem to be sampling the same population.

I will be having my class do a similar experiment this semester--with better instructions from the teacher--and after this I will conduct this study again.

Wednesday, January 21, 2015

M&M Binomial

This uses data gathered from the M&M Activity.

Let's begin this with a thought experiment.  Imagine you have the job of filling bags with M&Ms.  One might imagine that there is a huge bin that has been filled with M&Ms and that you are just parcelling them out into the bags.

There is a mountain of M&Ms and a certain proportion of these are red, orange, yellow, green, blue, and brown.  The number is so large that the act of choosing, say, a red M&M on one trial does not appreciably reduce the probability of getting one on the next trial.  All of this argues that, if one is interested in particular colors, each trial is a Bernoulli Trial with a fixed probability of success.

Each M&M is about the same weight and you are aiming to fill your bag to at least a certain weight but not more than one M&M more than that.  This results in the bags having a small variation in number of M&Ms per bag.  All of this means that we have a, more or less, fixed number of M&Ms per bag.

We combine these two observations, and what we have looks astonishingly like a Binomial Experiment.

Using a sample of 10 bags of Plain M&Ms, I investigated whether they did in fact follow the binomial distribution for red M&Ms.  This sample contained a total of 182 M&Ms of which 28 were red.  This yields a proportion p=0.154 of red M&Ms. The ten bags contained from 17 to 19 each. I therefore chose to set n=19.

Given those, I used my data to create a frequency table.  In the table below, the first column is the possible number of successes for a binomial experiment with 19 trials, that is to say the numbers from 0 to 19 inclusive; keeping with standard notation, that column is labeled x.  The second column is the number of bags that had that many red M&Ms.  As we are setting up do to a chi square test to see if the binomial model fits, we have labeled the frequency column with an O.

x O
0 1
1 2
2 2
3 0
4 4
5 0
6 1
7 0
8 0
9 0
10 0
11 0
12 0
13 0
14 0
15 0
16 0
17 0
18 0
19 0

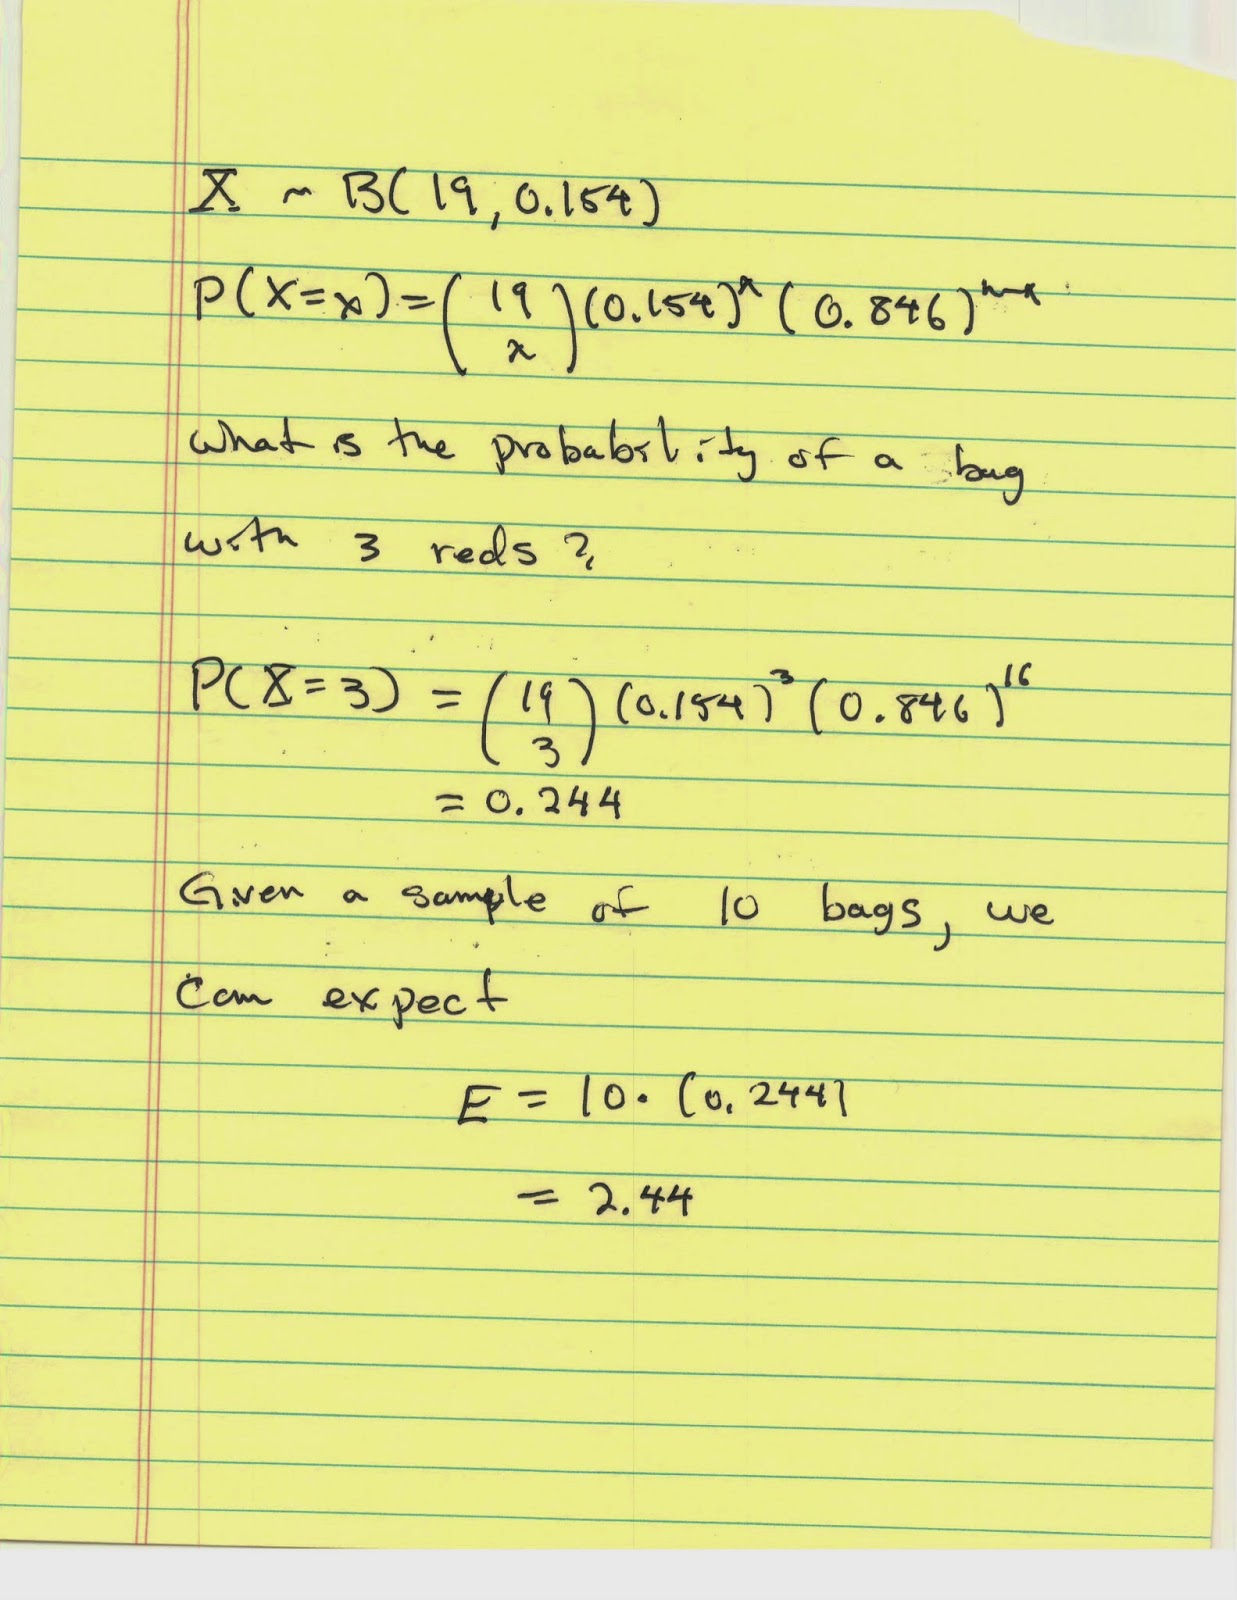
We ask the question of how well this fits with the expectations of the binomial distribution B(19,0.154).  I do the sample calculation for x=3 below:

Putting this calculation into a spread sheet, I obtain:

n O E
0 1 0.42
1 2 1.45
2 2 2.36
3 0 2.44
4 4 1.77
5 0 0.97
6 1 0.41
7 0 0.14
8 0 0.04
9 0 0.01
10 0 0.00
11 0 0.00
12 0 0.00
13 0 0.00
14 0 0.00
15 0 0.00
16 0 0.00
17 0 0.00
18 0 0.00
19 0 0.00

We can then compare the values of the O and the E columns by using the (O-E)^2/E measure.  The results are in the table below:

n O E (O-E)^3/E
0 1 0.42 0.81
1 2 1.45 0.21
2 2 2.36 0.06
3 0 2.44 2.44
4 4 1.77 2.80
5 0 0.97 0.97
6 1 0.41 0.85
7 0 0.14 0.14
8 0 0.04 0.04
9 0 0.01 0.01
10 0 0.00 0.00
11 0 0.00 0.00
12 0 0.00 0.00
13 0 0.00 0.00
14 0 0.00 0.00
15 0 0.00 0.00
16 0 0.00 0.00
17 0 0.00 0.00
18 0 0.00 0.00
19 0 0.00 0.00
Note that the sum of the (O-E)^2/E column is 8.32.  The critical number for the chi square test for this is 30.14.  This is the table look up with 19 degrees of freedom and a significance level of 0.05.

As 8.32 is not larger than 30.14, we cannot reject the null hypothesis of the chi square test.  The null hypothesis is that the model fits.  We've no proven that it is binomial, but we can say that our data is not inconsistent with the binomial distribution B(19, 0.154).

Do this test with the data you collected from the M&M Activity.

Friday, July 19, 2013

M&M Activity: Part 2

We are now going to process the data you collected and tabulated in the first part of this assignment.  Recall my data was as follows:
We will begin with the first row, the red M&Ms.  We will be learning how to deal with data in a frequency table.  The first step is to put that data into a frequency table.  There are a variety of ways to do this, but I am going to do this first row by ordering the data and then counting it.

Look first at the top part of the page.  In the first column which is labeled "Raw data," I've simply listed the numbers in the same order as they occured in the original table.  In the column labeled "ordered data," I've listed from the smallest to the largest.  This makes them easier to count.

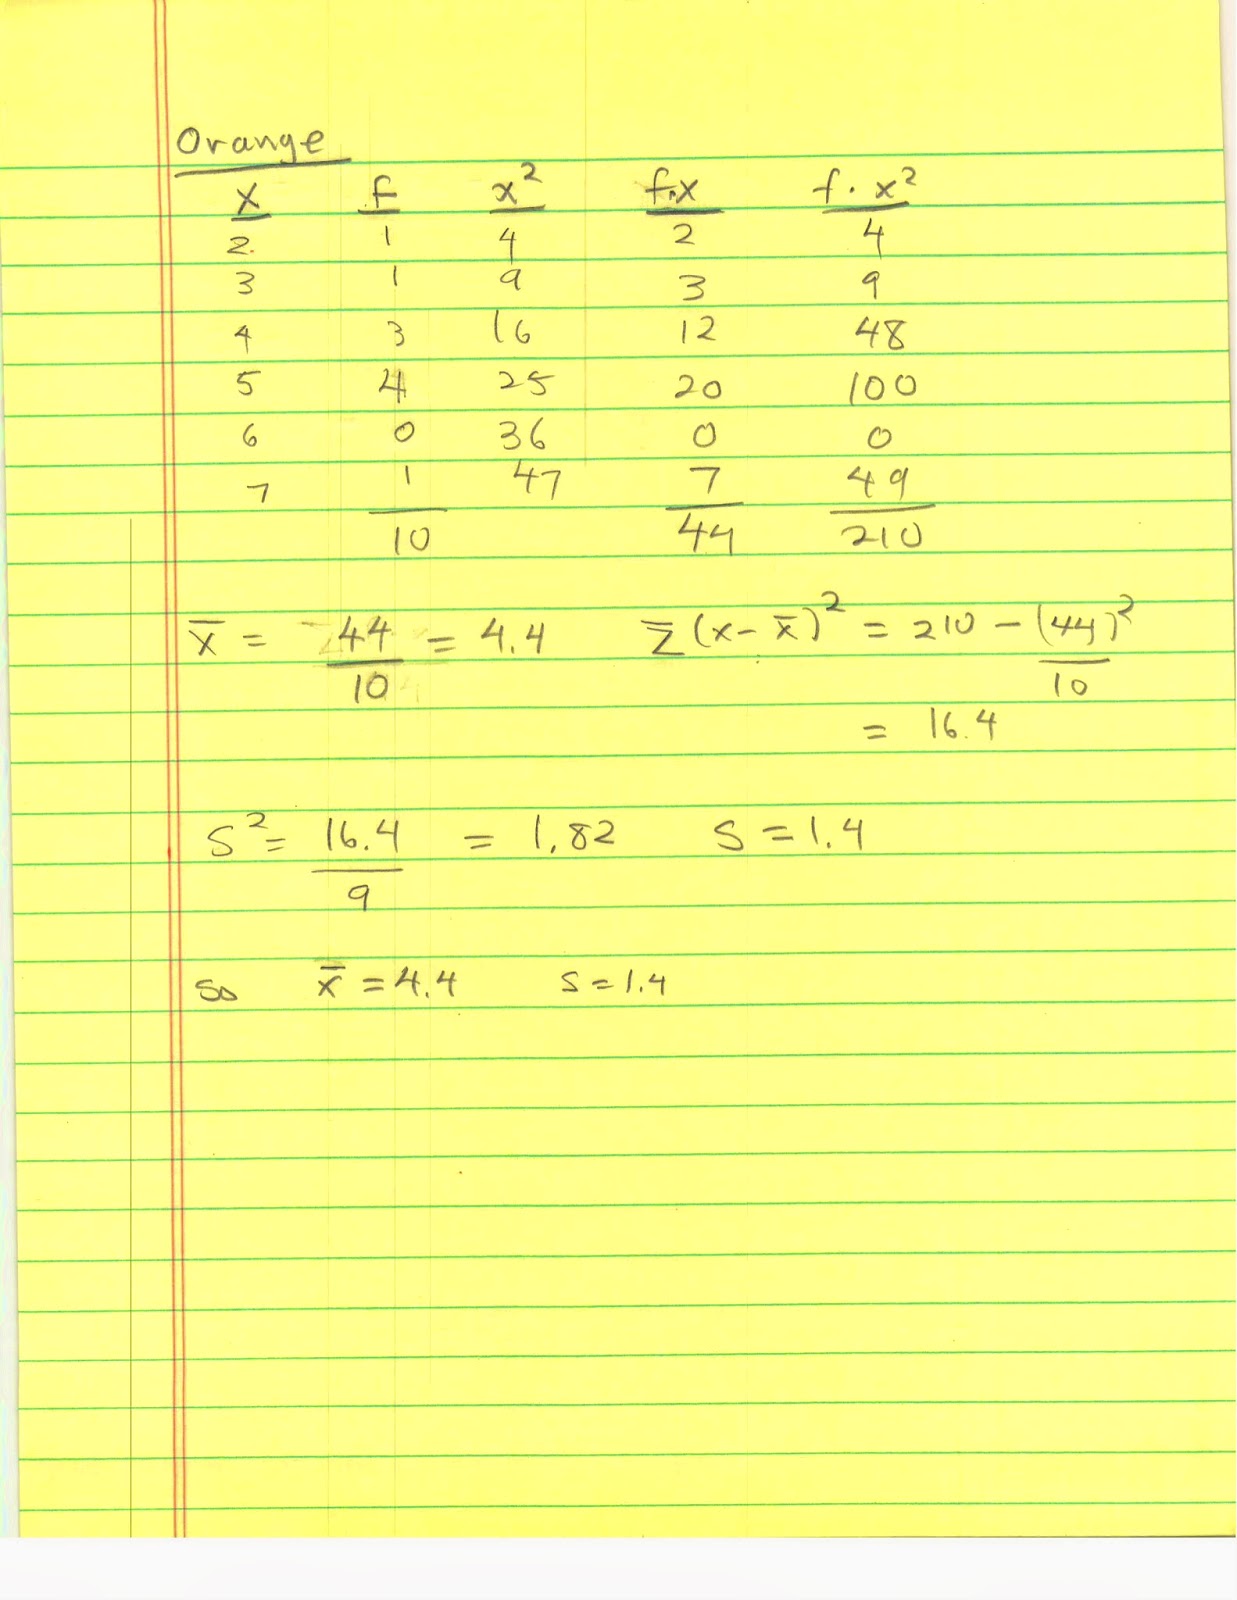
In the part of the page labeled "Frequency Table," I've set up a five column table with labels x, f, x2(x-squared), fx (f times x), and fx2 (f times x-squared).  In the x column, I put the possible values of x from the lowest that occurs to the highest.  There were 5 bags that contained only one M&M, there were 4 that contained 2, there were no bags that contained 3 (I could've left this row out if I wanted to), and there was one bag that contained 4 M&Ms.

So here f stands for frequency. 

In the x2 column, I've put the squares of the values from the x column.  It kind of makes sense, eh?

In the column labeled fx (f times x), I've put the product of the the value from the f column and the value from the x column: 5 times 1=5, 4 times 2= 8, 0 times 3=0, and 1 times 4 = 4.  I've done a similar thing with the column labeled fx2 (f times x-squared): 5 times 1=1, 4 times 4=16, 0 times 9=0, and 1 times 16 =16.

After filling in this table, I found the sums of the f, fx, and fx2 columns.  They are 10, 17, and 37, respectively. 

I knew before I started that--if I did everything right--the sum of the f column would be 10.  This is because we sampled 10 bags and the sum of the f has to be the sample size.

We can use the sum of the f column and the sum of the fx column to compute the sample mean, x-bar, which is 17/10=1.7.

We need the sum of the fx2 column to calculate the sample standard deviation.  As you may recall, the standard deviation is rather work intensive to calculate.  When you first learns how to calculate standard deviation, you first calculate the sample mean.  Then you put in a new column which consists of the difference between the value of the data item and the value of the sample mean. Then you put in a column which consists of the square of the previous column.  Then you add up that column.  Call the sum Fred (I just like the name) and divide that by the sample size minus 1. 

This is a lot of work just to get Fred. This is awkward as it requires you to calculate x-bar before hand.  However, there is a formula for Fred that removes the awkwardness.  This formula is hard to describe in typing, but I will give it a go. In your left hand, put the sum of the fx2 column.  In your right hand, put what you get when you divide the square of the sum of the fx column by the sum of the f column.  The left hand minus the right hand is Fred.

Don't worry, it's written out on the page above: 37-(17 squared)/10=8.1.  To get the sample standard deviation from this, we go to the next page:
The sample variance is Fred divided by sample size minus 1.  That is 8.1/9=0.90.  The sample standard deviation is the square root of the sample varience. This is 0.949..., but we round it off to one decimal place beyond the original data, making s=0.9.

I've done this for each of the colors of my data:
Your assignment is to take your data and go through this same process.  You will be working in groups, so I would suggest to organize your work in such a way as to have at least two people to independently do the calculations on each. 

The submission for each group may be organized as above.  In whatever way it is organized, it must include
  1. A table for each color of M&Ms with the five columns as above.
  2. A calculation of the sums of the f, fx, and fx2 columns.
  3. A calculation of x-bar (the sample mean) and of s (the sample standard deviation).

Thursday, July 11, 2013

M&M activity

To begin with each group will need the following;
  1. A sack of Fun-Size bags of M&M's.
  2. Small gummed labels.
  3. Sharpie/Felt tipped pen.
  4. Scissors.
  5. Notebook
  6. Pencil
  7. Smart phone with a camera.

(1) Your sack of Fun Size M&M bags should have at least 10 small bags of M&Ms.  You will need at least 10 little bags for this activity.
If you cannot find Plain M&Ms, Peanut will do.  Be mindful if anyone in your group has a peanut allergy though.  If you can't even find Peanut M&Ms, then some other candy will work.  I've had students use Skittles, but the colors are different and the distribution of colors is different.  When you begin the process, you will need ten bags of the same type of candy and each bag of that candy must have a variety of colors.

(2) You will need gummed labels and (3) a Sharpie to number those gummed labels.

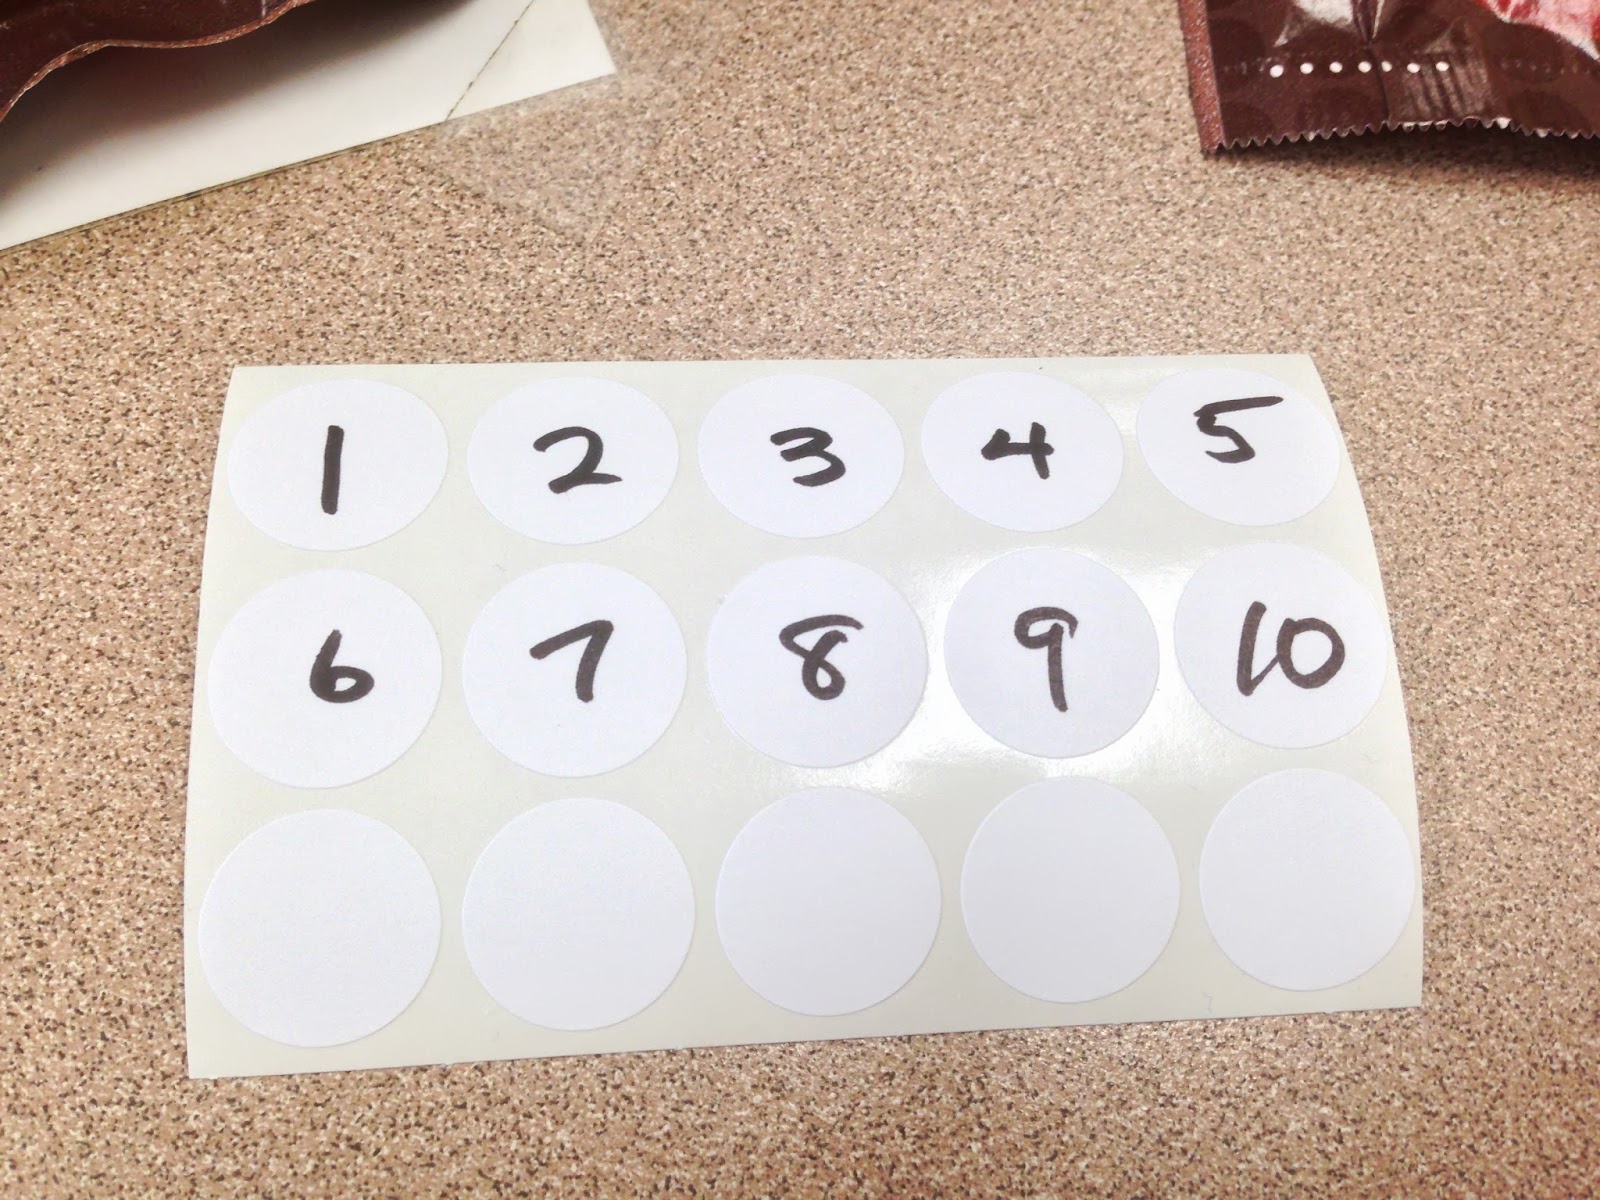
you will be using these labels to label 10 of your M&M bags as below:
You could possibly get by with masking tape and a pencil.  This would make it more difficult for me to read the picture your are going to take of this to prove that your group actually did the work.

You will also need (4) scissors to open each bag as below:

Yes, you could just rip it open. (WHY are you being so difficult?) If you rip it open, you might get carried away and spill the bag.  I know how you are under high-pressure situations.

Once you open the bag, you are going to sort the M&Ms by color, count them, and note the number of each color on a piece of paper like this:

The numbers along the top of the page correspond to the numbers you labeled each of the bags with.  The colors to the color of the M&Ms.  The first bag contains 1 red, 5 orange, 3 yellow, 5 green, 2 blue, and 2 brown M&Ms. You can read this off of the column labeled with a 1 at the top.  This is why you need the (5) notebook and the (6) pencil.  Yes, you could carve it in clay with a stick if you like, but isn't this way easier.

I would advise you to wash your hands before you start counting because you are going to eat them afterwards and if you don't wash your hands first you might catch something, but this is up to you.

Oh, yes, this will need to be done in such a way to document that you did it as a group.  Using a smartphone with a camera would be the easiest way.  Some of you Facebook funerals, for Heaven's sake, so you ought to be able to come up with a smartphone among you or your friends.

Your complete assignment will be the data that you've collected and some documentation that provides evidence that everyone took part in some way. I leave this up to you.